The Microbiome Report is a common collection of analyses performed on microbiome datasets when the analysis goal is to identify individual microbes or combinations of microbes which are associated with a particular group of samples.
The concept of association in this context refers to a consistent pattern of having an overall relative abundance in a particular group which is either higher or lower than the relative abundance in a comparison group.
Analysis Steps
- Calculating summary metrics for each microbe (mean, std, etc.)
- Calculating alpha diversity (Shannon)
- Performing Principal Component Analysis (PCA)
- Spatial embedding (UMAP)
- Unsupervised clustering (Leiden)
- Identify organisms associated with cluster labels (Kruskal-Wallis H Test)
- For user-specified categorical covariates (e.g. ’treatment’ vs. ‘control’), identify individual organisms associated with group labels (Kruskal-Wallis H Test)
- For user-specified continuous covariates (e.g. age), identify individual organisms associated non-parametrically with scalar value (Spearman rank correlation coefficient)
Figures
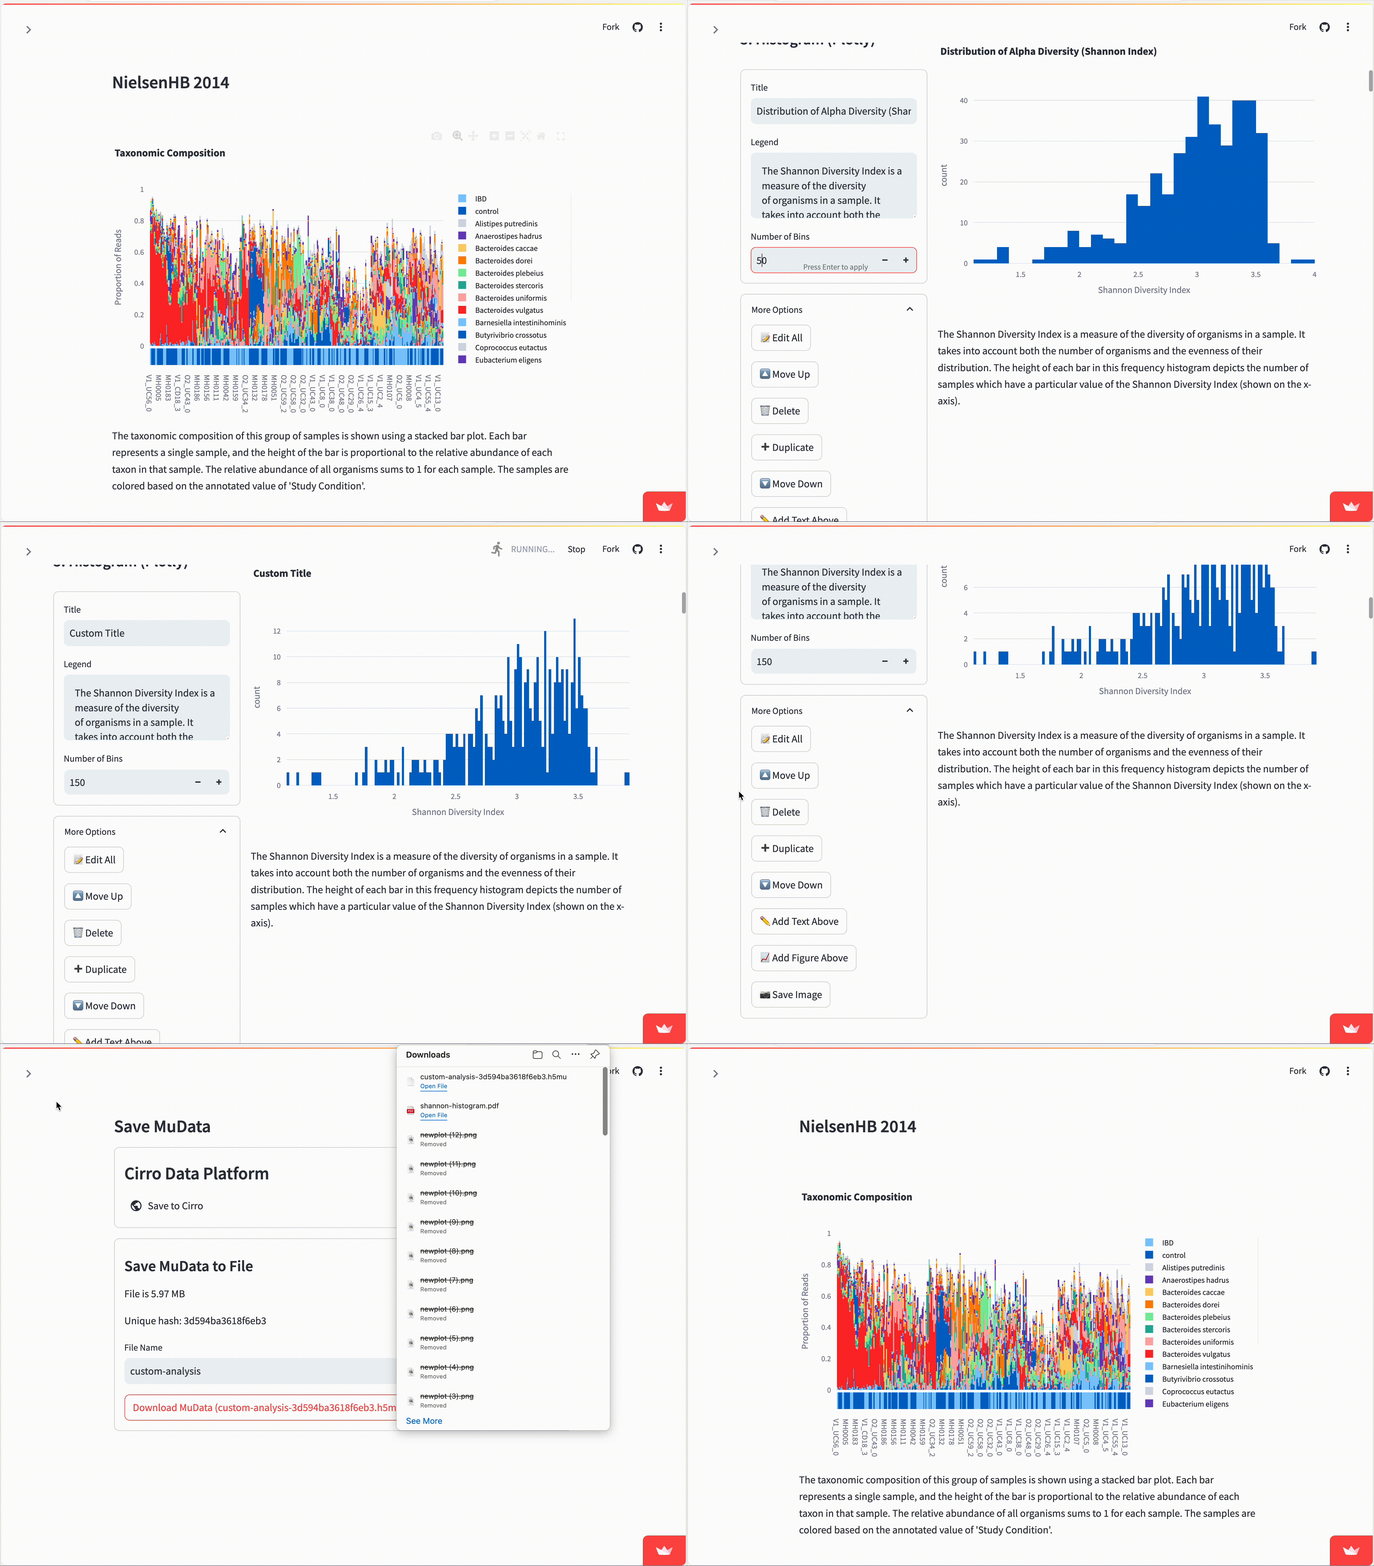
The figures shown below are examples from the NielsenHB 2014 dataset from the curatedMetagenomicData project. This data consists of 396 samples in total, 248 samples in the control group and 148 from individuals with Inflammatory Bowel Disease (IBD). The collection of living figures shown below may be viewed and edited at this link.


Making Changes
As with all Living Figures, the displays in the Microbiome Report may be edited and those changes may be saved and shared with collaborators.
For a longer description of how to make changes, read the overall description of the Living Figures project.

