The lingua franca of science and research are data visualizations known as ‘figures’ - scatter plots, bar charts, heatmaps, and other commonly used pictures which are used to describe characteristics of a dataset. While they are usually distributed as static images it can be useful to have some way of making changes and modifying the figures, following your curiosity about the question at hand.
This website describes a software project which is trying to make
it easier to publish figures which are editable and redistributable,
effectively living a new life in the hands of each viewer.
This project, the
mudata-explorer
combines the flexibility of the
AnnData/MuData
data structures with a simple syntax for displaying common figure
types.
Because the JSON schema for each figure can be embedded within the
MuData object and saved in
HDF file
format (*.h5mu), it becomes quite easy to distribute both figures
and their source data as an integrated package.
Viewing Figures
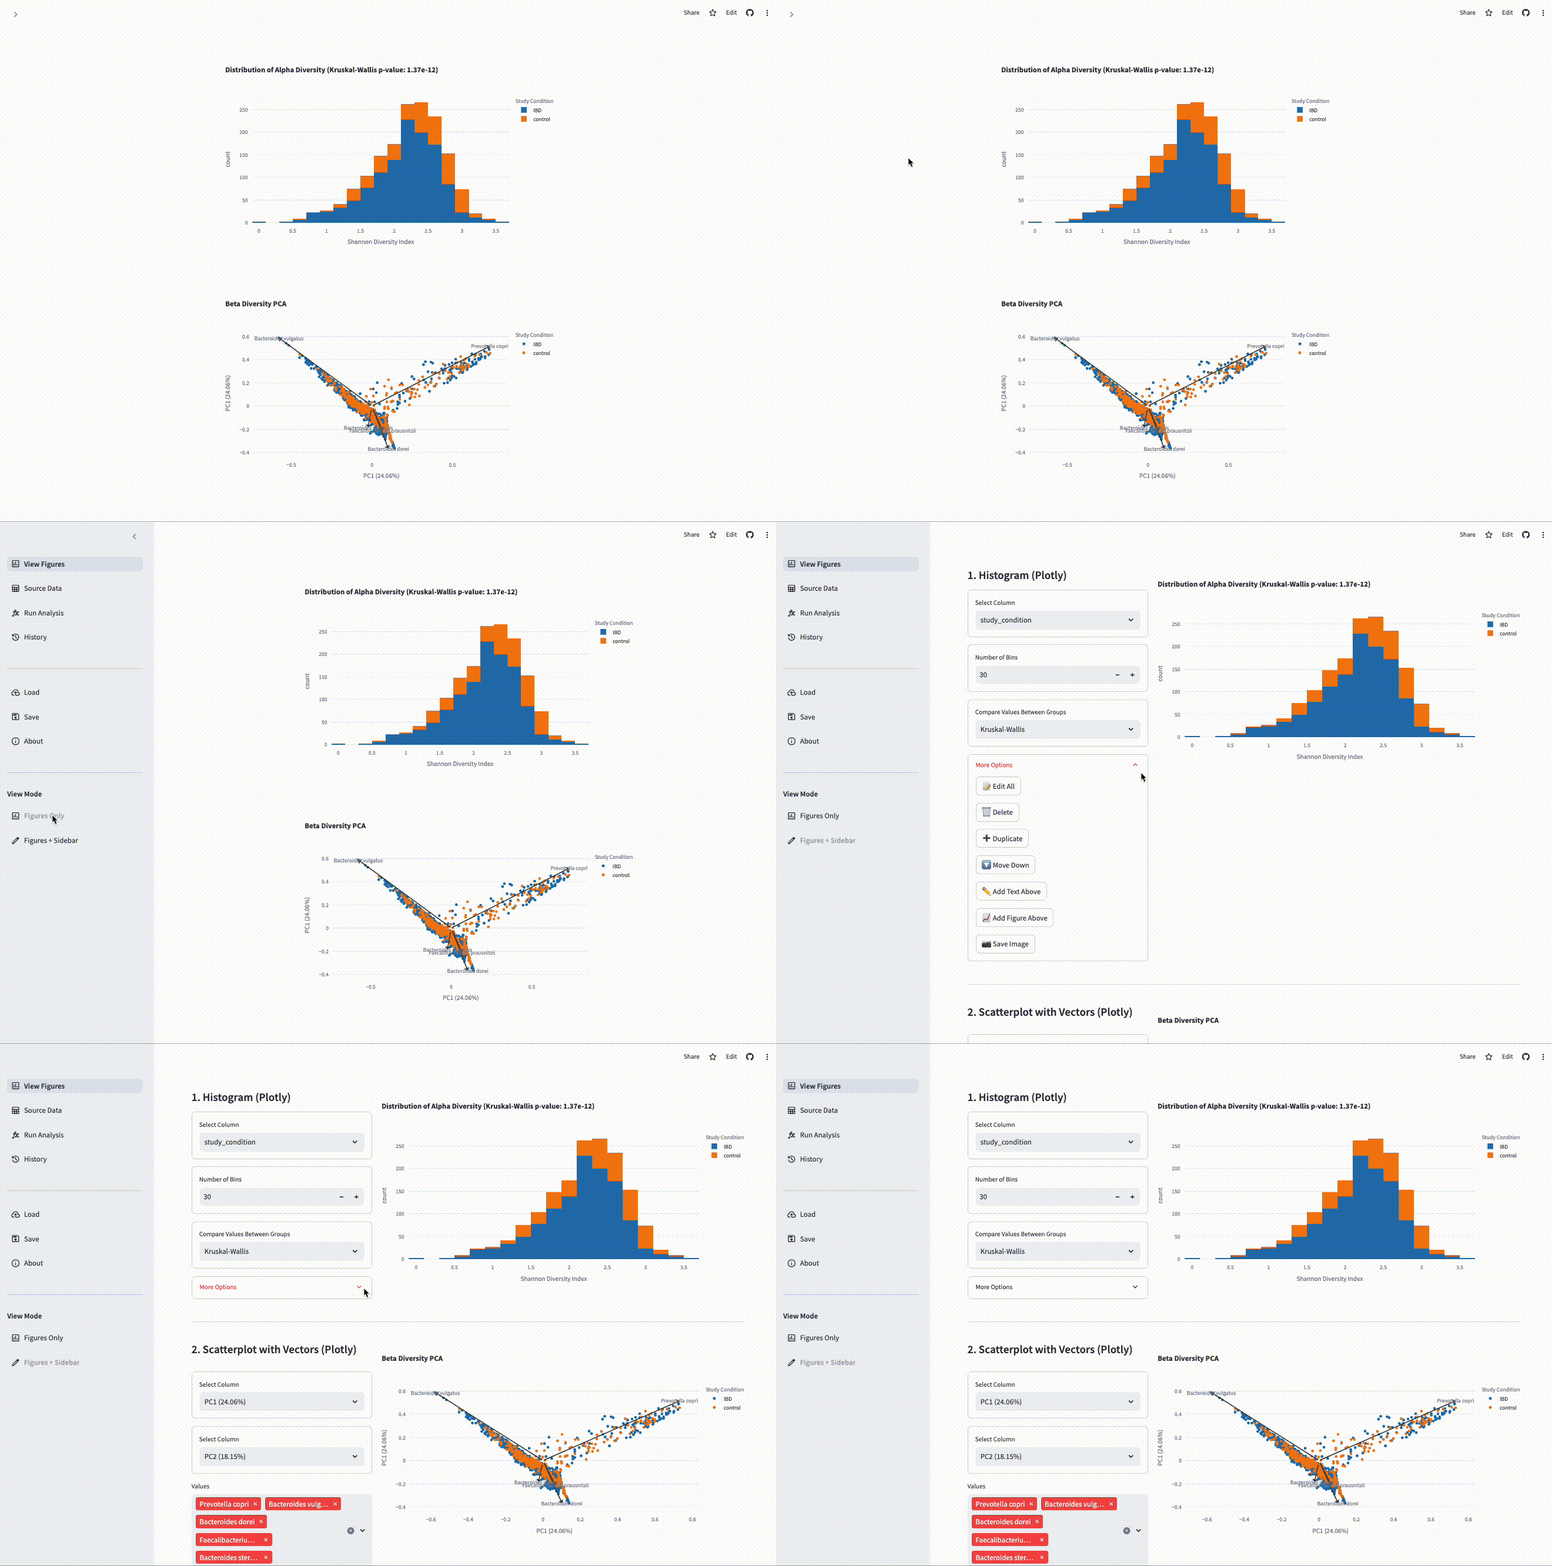
When you open a dataset, it may display a set of figures like this: a histogram and a scatterplot

Opening the Sidebar
Using the menu on the left, you can open the sidebar to access a set of controls used for modifying each figure.

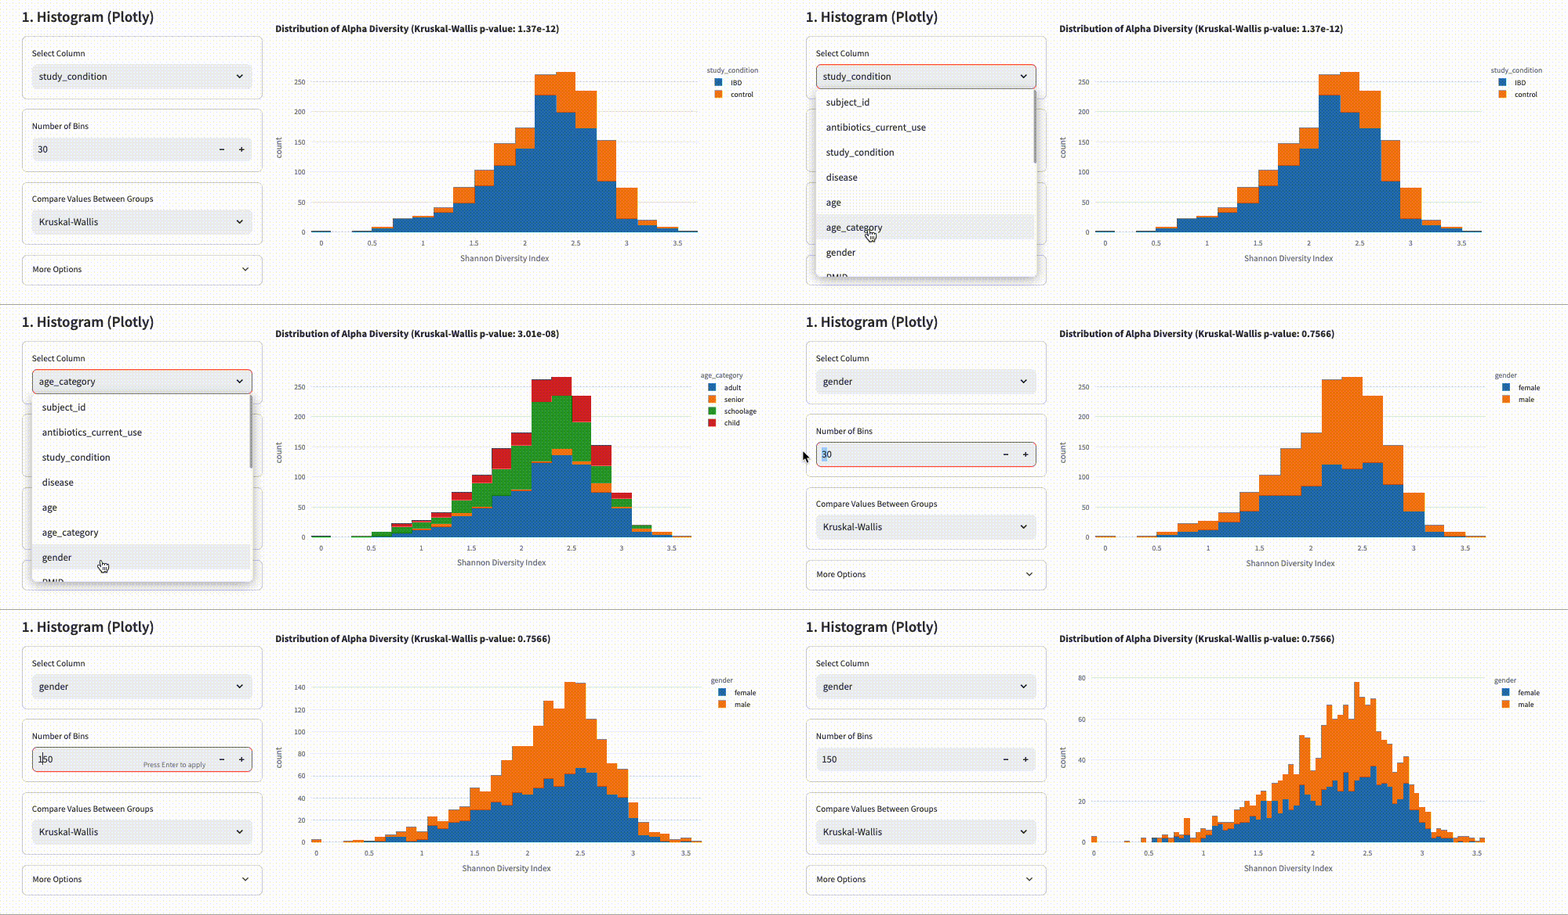
Using the Sidebar
The sidebar controls let you quickly modify the figure, which draws on the source data to provide as much flexibility as possible.

More Options
In addition to the settings displayed in the sidebar, you may update the full list of settings for the figure (including which source data elements are being bound to each figure axis) by selecting “Edit All” in the “More Options” menu.
The user may also:
- Rearrange, duplicate, and delete any figures
- Add new figure or text elements
- Save the image as PDF/SVG/PNG
Get Started
Sharing Your Work
Using the menu on the left you can:
- Save or load the dataset to/from a file on your computer
- Save or load the dataset to the Cirro data platform
- Hyperlink to a dataset available on the web

